Binary Instruction Word Clouds
 Cody Pierce (codypierce) <cpierce Cody Pierce (codypierce) <cpierce tippingpoint tippingpoint com> com> |
Friday, January 19 2007 00:40.35 CST |
I have been working on an x86 emulator in python recently and before starting I did some research into just how many instructions in the hundreds are actually used in a real world binary. The results weren't surprising in that only a handful are *really* used. Id say 30 or so are used 80% of the time. With that in mind I thought it would be interesting to use the popular "word cloud" data representation to display those instruction. The word cloud is simple in that the more occurrences get a heavier weight (font). Since this blog wont let me add the real page here is an image.
XP SP2 kernel32.dll (961K)

Click here for page that includes counts
XP SP2 shell32.dll (8256K)

Click here for page that includes counts
Kind of a novel idea. I suppose you could also do something like represent heap chunks by address and weight them based on access, or windows API calls and use.
Comments
 sp sp |
Posted: Friday, January 19 2007 01:54.12 CST |
|
It's only tangentially related but at Black Hat USA 2006 Daniel Bilar held a presentation where he tried to distinguish between malware and regular programs using the assembly instruction distribution of files (among other things). There are lots of opcode distribution stats in his slides. http://www.blackhat.com/presentations/bh-usa-06/BH-US-06-Bilar.pdf |
|
 Piotr Piotr |
Posted: Friday, January 19 2007 07:08.20 CST |
|
Well its an old topic, if you mean opcode frequency statistics. Even virus writers attempted to research this topic few years ago (f.e Z0mbie - Opcode Frequency Statistics, - although MISTFALL had a limited disassembler). Moreover, a lot of AV engines already includes opcode frequency statistics as part of heuristics. For example engine automaticly switch to deep-scan mode if it will find some suspicious instructions like sti/cli... bla bla (of course assume we are r3 in this example). cheers. |
|
 otto otto |
Posted: Friday, January 19 2007 07:35.38 CST |
| It is instresting that there are 4-8 times as much calls as there are RETNs. Are there other causes for this than imported functions? | |
|
sp |
Posted: Friday, January 19 2007 07:38.44 CST |
|
otto: A function can be called from multiple locations but most functions compiled by regular compilers have just one ret instruction (following the single entry, single exit principle). call foo call foo call foo proc foo: ret 3 times more calls than rets. :) |
|
|
otto |
Posted: Friday, January 19 2007 07:45.31 CST |
| What was I thinking! Of course that's the reason. I guess I thought they were some run-time statics (e.g. from an emulator). *shame on me* | |
|
Piotr |
Posted: Friday, January 19 2007 07:47.00 CST |
|
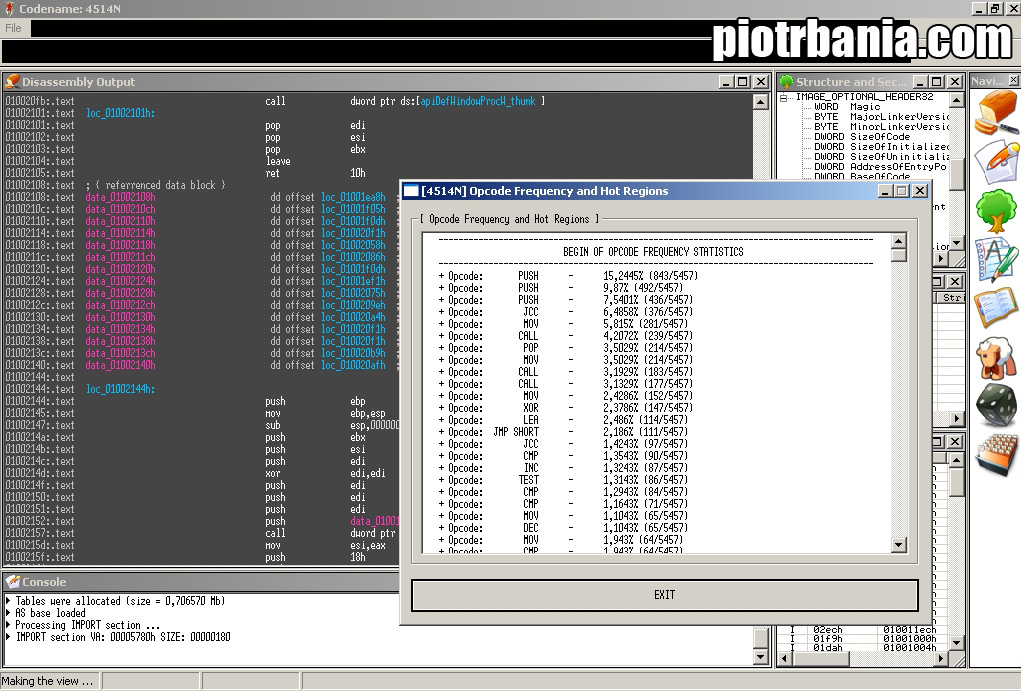
And in case u havent seen, some opcode frequency counter from my Aslan project: http://piotrbania.com/all/4514N/a1.jpg. Note: there are few different variation forms of same instruction, so they are splitted - leaving the same name couple of times, one stands for one form. |
|
 pedram pedram |
Posted: Friday, January 19 2007 10:42.53 CST |
|
Piotr: Well its an old topic, if you mean opcode frequency statistics. Even virus writers attempted to research this topic few years ago (f.e Z0mbie - Opcode Frequency Statistics, - although MISTFALL had a limited disassembler). I don't think he meant that generally analyzing opcode frequencies is new/cool just the way of showing it with the HTML word cloud. |
|
|
Piotr |
Posted: Friday, January 19 2007 10:49.05 CST |
|
Pedram: Ah well, but i still prefer suns. |
|
|
Sellmi |
Posted: Saturday, January 20 2007 03:17.49 CST |
|
@codypierce this representation is a wonderful idea ;) |
|
 stam321 stam321 |
Posted: Sunday, January 21 2007 03:52.03 CST |
|
About the emulation, How many instructions per second can it handle? |
|